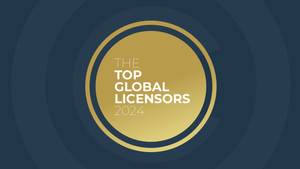
Read The 2022 Top Global Licensors Report Now!
Find out which brand owners lead retail sales for licensed consumer products in License Global’s exclusive annual report.
July 1, 2022

At a Glance
- The most powerful brands based on prior-year merchandise sales and the activity that helped them to achieve that outcome.
- Strategy and category insights from the world’s largest brands.
- Brandscape offers directional market indicators on trends and what matters most to brand licensors.
License Global's most sought-after report is here!
The Top Global Licensors Report ranks the performance of brands’ licensed consumer products at retail for fiscal year 2021, while highlighting the key strategies, collaborations, and extensions they leveraged to achieve positive growth. This year’s report notes a positive shift as recovery remains at the fore for all businesses as we turn the page on another pandemic year.
Find out the total retail sales reported for the 88 licensors that submitted, and which of those brand licensors are bringing in at least $1 billion at retail. Read the full report here!
The Top Ten Global Brand Licensing Companies
Rank | Company | Retail Sales 2021 | Retail Sales 2020 | Last Year's Ranking |
1 | $56.2B (E) | $54B | 1 | |
2 | $35.9B | $30.1B (formerly Meredith Corporation) | 2 | |
3 | $21.7B | $13.8B | 3 | |
4 | $15B | $11B | 4 | |
5 | $8.5B | $5.1B | 8 | |
6 | $8.4B | $7.8B | 5 | |
7 | $8.3B | $7.5B | 6 | |
8 | $7.4B (E) | $2B (E) | 22 | |
9 | $6.5B | $4.5B | 9 | |
10 | $6B | $5.8B (formerly ViacomCBS) | 7 |
Inside this Report:
The most powerful brands based on prior-year merchandise sales and the activity that helped them to achieve that outcome
Strategy and category insights from the world’s largest brands
Brandscape, a directionally informed market survey of brand licensor activity, from License Global, that includes the product categories licensors will bank on in 2023, top performing licenses and entertainment properties and more statistics and infographics
And more!
Read License Global’s Top Global Licensors Report here!
Read more about:
Top Global LicensorsAbout the Author(s)
You May Also Like
