Subscribe and receive the latest news from the industry Article
Join 62,000+ members. Yes, it's completely free.
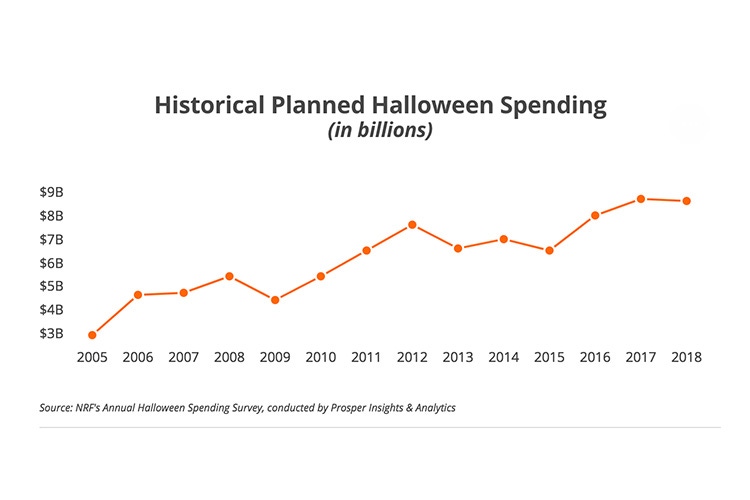
This year, American shoppers are expected to spend roughly $9 billion for Halloween, according to the National Retail Federation.
September 28, 2018
 This year, American shoppers are expected to spend roughly $9 billion for Halloween, according to the National Retail Federation.
Shoppers are set to spend an average of $86.79, up from last year’s $86.13. Total spending is expected to reach $9 billion, the second highest in the survey’s history, with more than 175 million Americans planning to participate.
The findings are part of the NRF’s annual survey conducted with Prosper Insights & Analytics.
According to the survey, consumers plan to spend $3.2 billion on costumes (purchased by 68 percent of Halloween shoppers), $2.6 billion on candy (95 percent), $2.7 billion on decorations (74 percent) and $400 million on greeting cards (35 percent).
 “The economy is good and consumer confidence is high, so families are ready to spend on Halloween this year,” says Matthew Shay, chief executive officer and president, NRF. “Retailers are stocking up to supply children, pets and adults with their favorite decorations, candy and costumes for the season.”
Additionally, 70 percent of consumers plan to hand out candy, 50 percent will decorate their home or yard, 48 percent will wear costumes, 45 percent will carve a pumpkin, 32 percent will throw or attend a party, 30 percent will take their children trick-or-treating, 21 percent will visit a haunted house and 18 percent will dress their pets in costumes.
“One of the biggest trends this year is the growth of spending on pet costumes,” says Phil Rist, executive vice president, strategy, Prosper Insights. “Out of the 31.3 million Americans planning to dress their pets in costumes, Millennials (25-34) are most likely to dress up their pets, the highest we have seen in the history of our surveys.”
Of those dressing up for the holiday, the NRF found that 3.8 million children plan to dress as their favorite princess character; 2.2 million as Batman characters; 2.5 million as their favorite superhero; 1.9 million as their favorite Star Wars character; and another 1.9 million as a witch. Meanwhile, 7.2 million adults plan to dress as a witch; 2.5 million as a vampire; 2.1 million as a zombie; 1.9 million as a pirate; 1.3 million as their favorite Avengers Character including Iron Man and Black Panther.
Costumes Ranked: Children
1. Princess - 7.6 percent
2. Superhero - 4.9 percent
3. Batman - 4.3 percent
4. Star Wars character - 3.7 percent
5. Witch - 3.6 percent
6. Spider-Man - 3.5 percent
7. Avengers character (excluding Spider-Man) - 3.2 percent
8. Ghost - 2.9 percent
9. Pirate - 2.0 percent
10. Frozen (Elsa, Anna) - 1.7 percent
Costumes Ranked: Adults
1. Witch - 10.7 percent
2. Vampire - 3.7 percent
3. Zombie -3.1 percent
4. Pirate - 2.9 percent
5. Avengers character (excluding Spider-Man) - 2.0 percent
6. Batman - 2.0 percent
7. Star Wars character - 1.9 percent
8. Ghost - 1.8 percent
9. Superhero - 1.8 percent
10. Clown - 1.6 percent
11. Wonder Woman - 1.5 percent
Costumes Ranked: Pets
1. Pumpkin - 11.2 percent
2. Hot dog - 7.4 percent 3. Bumblebee - 4.9 percent
4. Devil - 3.2 percent
5. Cat - 3.1 percent
6. Dog - 3.1 percent
7. Lion - 2.9 percent
8. Star Wars character - 2.8 percent
9. Superhero - 2.7 percent
10. Ghost - 2.5 percent
The survey also found that 45 percent of shoppers will visit discount stores for Halloween-themed items, 35 percent will shop at specialty stores, 24 percent will visit supermarkets, 25 percent will buy at department stores and 24 percent will shop online.
Read more about:
National Retail FederationYou May Also Like

Apr 1, 2024
Apr 1, 2024